

At a Glance
Field Service Reporting Definition: Field service reports are structured summaries of operational data that track technician performance, job efficiency, and customer interactions in real time.
Key Metrics to Track:
- Technician utilization
- First-time fix rate
- On-time arrival percentage
- Average travel time
- Customer engagement and satisfaction
- Mileage and fuel usage
If you look at your various apps and spreadsheets right now, you’re likely staring at thousands of data points in the form of timestamps, GPS pings, customer signatures, and photos. But looking at it, can you actually tell, for example, which crews made you money and which ones just burned fuel?
If you can’t, your real problem is visibility, not data.
Data is just noise until it’s organized into a story that makes sense. Without structured field service reports, you’re flying blind, guessing which technicians are your top performers, wondering why your fuel costs are spiking, and hoping your customers are actually happy.
This guide will break down what field service reporting looks like in 2026, which metrics actually matter, and how to turn that mountain of data into a tool for growth.
What Are Field Service Reports?
At its simplest, field service reports are structured summaries of operational data. They take the raw activity from the field, like travel times, job durations, and customer feedback, and aggregate it into a format that you can actually use to make decisions.
In 2026, these reports are no longer static PDFs or spreadsheets. They are real-time dashboards that allow operations teams to track performance, justify resource allocation, and pivot strategies before a small issue becomes a massive bottom-line problem.
Why Reporting is the “Control Tower” of Your Operations?
If you operate without reporting, you are reactive. You wait for a customer to complain or for a vehicle to break down before you take action. Reporting allows you to be proactive.
Even better, when you tie reporting into your dispatch and scheduling, you gain control over three pillars of field execution:
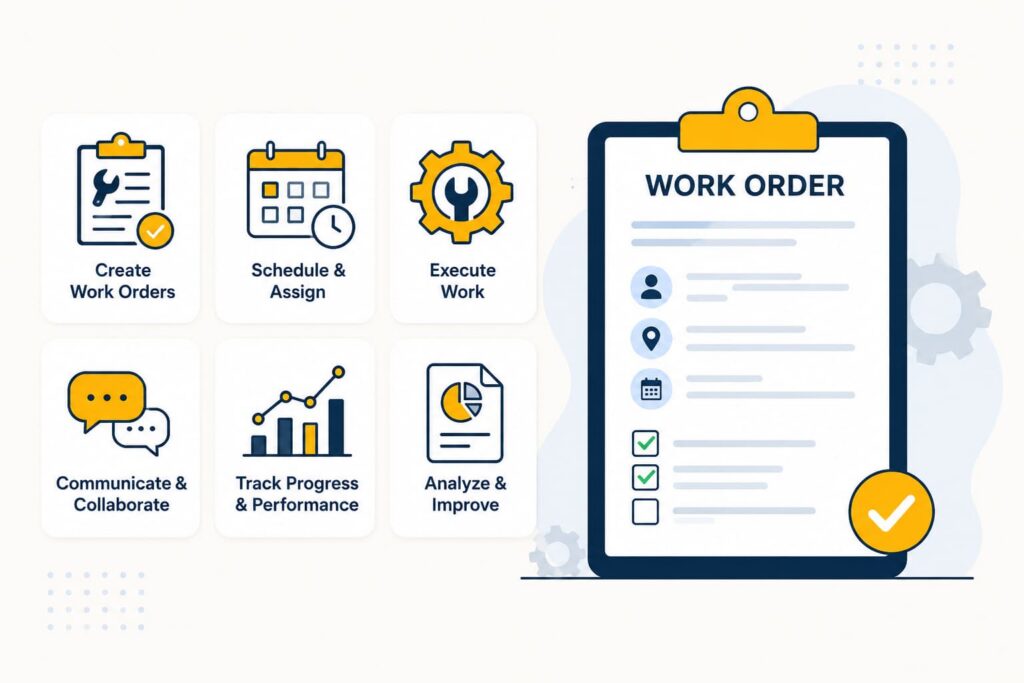
How Field Service Reporting Works?
Effective reporting is a continuous loop that starts the moment a work order is created, not something that happens once a month. The flow looks like this:
The 5 Types of Field Service Reports Every Operations Team Needs
Based on the capabilities of modern platforms like Arrivy, here are the five reporting categories that provide the most “bang for your buck.”
1. Project & Task Reports
These give you a “macro” and “micro” view. Project Reports show you the overall status, like how many installs are completed versus canceled. Task Reports dive into the accumulated time spent and average travel time per task. This is how you identify if your “estimated time” matches the “actual time” in the field.
2. Performance & Utilization Reports
This is about your people. A Team Utilization Chart illustrates exactly how much time each member spends on-site versus driving on the road. If a tech is spending 60% of their day driving, you have a route planning problem, not a productivity problem.
3. On-Time Performance
On-Time Performance report tracks how often your jobs start within the promised window. Arrivy’s reports, for example, show the percentage of jobs that start early, on time, or late. This is the single most important metric for customer trust.
4. Customer Engagement & Reputation
In 2026, “reputation management” is part of operations. You need to track:
- NPS Score: Are your customers Promoters, Passives, or Detractors?
- Engagement: How often do customers actually click the “Live Track” link to watch their tech arrive?
- Review Trends: What are the most and least favorable comments being left?
5. Time & Payroll Reports
A Time & Payroll report shows you a granular summary of hours. You need to see the breakdown of Travel Time, Work Time, and Non-Work Time. This ensures your payroll is accurate and your labor costs are tied directly to specific job entities.
Key Metrics to Track (The “Must-Haves”)
If you track everything, you track nothing. Focus on these seven KPIs:
| Metric | Why it Matters |
|---|---|
| First-Time Fix Rate | Measures efficiency, avoids costly callbacks. |
| Avg. Travel Time | Identifies if your routing is optimized. |
| Technician Utilization | The % of a tech’s day spent on revenue-generating work. |
| On-Time Arrival % | The primary driver of customer satisfaction. |
| On-Schedule Completion | Measures if your “estimated durations” are accurate. |
| Customer Response Rate | Shows if your communication (SMS/Email) is effective. |
| Mileage Tracking | Critical for fuel expense management and vehicle maintenance. |
Manual vs. Automated Field Service Reporting
If your “reporting” involves a manager spending four hours at the end of a week manually combining Excel sheets, your reporting is broken and unreliable.
Manual Reporting:
- Prone to human error and “rounded” numbers.
- Outdated by the time the report is finished.
- Relies on techs remembering to write things down.
Automated Reporting:
- Instant Visibility: You can view data for the last 24 hours, 7 days, or 3 months with a click.
- Ground Truth: Data is tied to GPS and real-time status triggers.
- Actionable: You can filter by “Group” or “Team Member” to find the exact root of a problem.
Moreover, reporting shouldn’t just be for the boss to look at after things are beyond repair. Reporting should guide you to immediately spot and solve problems and change how you work the next day.
With Arrivy’s smart field service reporting, you can achieve:
Better Dispatch Decisions: If reports show that Crew A is 15% faster at HVAC installs than Crew B, you can dispatch them to the more complex jobs.
Route Optimization: Identifying high average travel times allows you to shrink your service zones and save on fuel.
Enhanced Customer Experience: By tracking “Live Track” views, you can see if your customers value the transparency. If 90% of them use the map, you know that’s a feature worth keeping.
Data-Driven Growth: Reports tell you when it’s time to hire. If your team utilization is consistently at 95%, your people are burnt out. You have the data to justify the new hire.